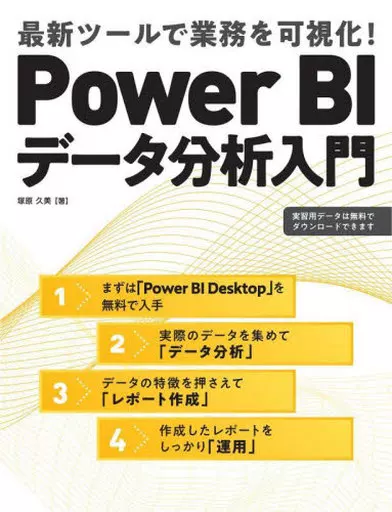
Information science Introduction to Power BI Data Analytics / kumi Tsukahara


Product description ※Please note that product information is not in full comprehensive meaning because of the machine translation.
Information Science
[Content introduction]
Microsoft Power BI is a BI (Business Intelligence) tool provided by Microsoft that can easily extract and combine large amounts of data. It is a tool for responding to the needs of "I want to process large amounts of data quickly," "I want to analyze data using various indicators," and "I want to share information with project members." It can be said that it is an essential business tool in the coming era. Power BI is the best way to perform "data analysis" work that has been done using Excel until now. It is relatively easy to operate with a concept similar to Excel, but when you try to touch it, there are many people who wonder where to start. This book explains Power BI in detail. The examples covered in this book are available for free of charge. First, obtain Power BI Desktop, which is provided free of charge, and work with sample data according to the instructions in this book. You should be familiar with Power BI and become familiar with data analysis work.
Contents
Chapter 1 Overview of Power BI and Environment for Data Analysis
1-1 BI Tool and Environment for Data Analysis
1-1 BI Tool and Environment for Data Analysis
<3-3 Creating Doughnut Charts
2-3-4 Creating Composite Charts
2-4-1 Creating Tables
2-4-2 Creating Cards
2-4-3 Creating Text Boxes
2-5 Features for Data Analysis
2-5-1 Drill-Down and Drill-Up
2-5-2 Drill-Through
2-4-3 Creating Text Boxes
2-5-1 Useful Reporting
Chapter 3 Practical Reporting
3-1-1 Multi-Year Sales Reporting Image
3-1-2 Multi-Year Sales Reporting Confirmation
3-1-1 Practical Data Utilization
3-2-1 Multi-Year Sales Reporting Image
3-1-2 Incorporating Data Stored in Folders or Access Data
3-3-2 Using Calculated Columns
3-3-2 Creating Your Own Date Tables
3-3-2 Utilizing Measures
3-3-2 Creating Your Own Date Tables
3-3-3 Practical Reporting
3-3-1 Multi-Year Sales Reporting
3-3